|
COVER STORY, DECEMBER 2005
AS GOOD AS IT GETS
Now is the time to act for multifamily borrowers.
Faron Thompson
 |
Thompson |
|
The multifamily capital market is very much alive and well and continues to be borrower-friendly. To understand the current trends in the cost of multifamily capital, let's look at today's marketplace compared to 12 months ago to grasp where the cost of capital is headed in the next 6 to 12 months. At a fundamental level, the cost of capital is composed of two parts: a base rate and the investor spread. Base rates are any underlying index used as a starting point for the cost of capital. Commonly used base rates include LIBOR, Treasuries and Prime. These are market-wide indexes that largely affect everyone the same way and are widely known, understood, stable and predictable. Base rates can be considered more science than art. On the other hand, spreads are derived from how individual lenders factor their expenses, risk premium, reserves and profit. Spreads vary from lender to lender and are considered more an art than science.
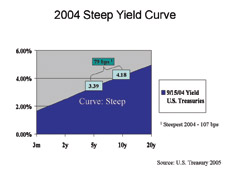
With base rates, Treasuries and their relation to each other are two of the most widely recognized barometers used to describe the interest rate climate. Treasuries are issued in varying length maturities. As a basic indicator, on any given day, you can plot the rates for each of the Treasuries and determine what's referred to as the curve. The wider gap — between the shortest term Treasury and the longest term Treasury — is generally referred to as a steep curve. When the gap narrows between the shortest term Treasury and longest term Treasury, it is a flat curve.
In looking at Graph 1: 2004 Steep Yield Curve, the Treasury curve last year was considered fairly steep with a gap of 79 basis points between the 5-year Treasury at 3.39 and 10-year Treasury at 4.18. The curve was even steeper earlier in the year when that same gap between the 5- and 10-year Treasuries reached 107 basis points.
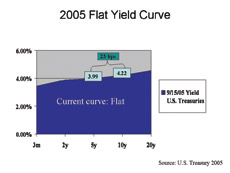
In Graph 2: 2005 Flat Yield Curve, one year later, the yield curve is much flatter, with the 5-year Treasury at 3.99 and the 10-year Treasury at 4.22 equating to only a 23 basis point separation between the 5- and 10-year Treasury.
In addition to understanding what has happened to long- and short-term base rates and, in particular, Treasuries over the past 12 months, it's also important to look at the movement of investor spreads.
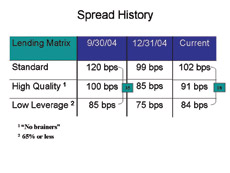
For a simple analogy, agency, life, company and conduit spreads have been synthesized into a single hypothetical lending matrix with standard, high-quality and low leverage spreads. Standard spreads are the standard price a lender might quote without receiving any real data about a particular project. This is compared to high-quality spreads or “no brainer” deals which, over the past 3 years, have been harder to find. Finally, low leverage spreads are reserved typically for deals at 65 to 70 percent or less loan-to-value.
In looking at Chart 1: Spread History, on September 30, 2004, spreads were 120, 100 and 85 basis points, respectively, for standard, high-quality and low leverage properties, with a spread gap of 35 basis points between low leverage pricing and standard matrix pricing. Spreads fell across the board throughout the end of 2004 to 99, 85 and 75 basis points, respectively. Since year-end 2004, spreads have remained tight at 102, 91 and 84 basis points. Most notably, the spread gap between standard matrix and low leverage has compressed from 35 basis points a little over a year ago to 18 basis points today. The big winner in this spread compression is the higher leveraged borrowers, as the low leveraged spreads have stayed in a much tighter range.
After framing the trends in the base rate and the investor spreads for the past 12 months, let's look at how this has affected a couple of the major capital strategies. Generally, debt/equity capital comes in two primary flavors: fixed rate or floating rate. The steep yield curve in 2004 made floating rate debt extremely attractive, especially when the floating rate debt included a reasonable lifetime cap.
In Chart 2: Capital Strategies, in 2004, floating rate borrowers were paying 3.25 percent for their debt with a lifetime cap at 6 percent. This contrasted to fixed-rate borrowers who were borrowing money at 5.30 for a comparable term. Borrowers were accepting the 70 basis points or so upside risk to save 200 basis points over the cost of fixed-rate debt. Additionally, the steep yield curve enticed borrowers to accept slightly shorter terms for significant price breaks in interest rate. Specifically, going from a 10-year to a 9-year term or from a 9-year to an 8-year term provided spread savings of 16 to 22 basis points per year.
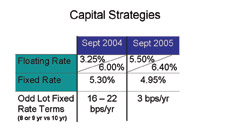
Today, with the dramatic shift in the yield curve from steep to flat, the strategies have reversed positions. The same floating rate borrower is paying 5.50 percent and would be getting a 6.40 percent cap for a new loan origination. However, the fixed-rate alternative is at 4.95 percent. Additionally, given that both the actual pay rate and cap for the floating-rate debt exceed the fixed-rate, fixed-rate underwriting today generates more loan dollars than floating-rate underwriting. The flat yield curve has also neutralized the advantage for shortening the term by a year or two as that only generates a 3-basis-points-per-year savings.
So, now that the competitive advantage of abbreviating loan terms or using floating-rate debt with caps has been neutralized by the flattened yield curve, where are the current opportunities? The answer is: it's real cheap to go long. Use the yield curve advantage to lock rates today that will fund in the future.
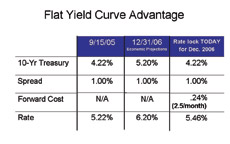
In Chart 3: Flat Yield Curve Advantage, on September 15, 2005, the 10-year Treasury was 4.22 percent and the spread was 1.00 percent, which resulted in a rate of 5.15 percent for the borrower. In late 2006, borrowers might be faced with rates for the 10-year Treasury more like 5.20 percent resulting in 6.20 percent rate (assuming no spread widening). Therefore, by taking advantage of the cheap cost to go forward, borrowers can lock rates today that will fund rather inexpensively 12 to 18 months in the future. With the forward cost being just 24 basis points, the resulting rate will be 5.46 percent, a savings of about 70 basis points over today.
Most important, capital in the near future for multifamily property owners and developers is at the lowest ever. Whereas 1.25 times debt coverage has been the historical best case, lenders are routinely using 1.20 coverage. Everyone now has 85 percent lending capabilities including Freddie Mac and Fannie Mae, which recently announced 85 percent mezzanine products. Compare this to some conduits and life companies, which are already using mezzanine products and now going to 90 percent. While interest-only loans have historically been used for lower leveraged and higher quality transactions, it is commonplace in nearly all loans today. And as previously noted, Treasuries remain on the low side of the historical range. Finally, spreads are as low as possible, given the lenders' need to make a little money on the transaction.
So, what can borrowers expect going forward? Treasuries will rise and most economists are in agreement with this general trend. Spreads will hold or widen. As previously noted, lenders don't have much room for movement. Lender portfolio retention strategies will increase. This plays in very nicely with the low cost to go forward on fixed-rate debt. Mortgage Banking Association statistics say the next 3 years will have a windfall of maturity and refinance opportunities given the prevalent use of 10-year fixed-rate debt in the mid- to late- 1990s. Lenders are going to get very aggressive to keep as much of this business on their books as possible, and they have already begun to introduce various portfolio retention strategies. Finally, expect to see the “T” word re-enter the financial arena. There's been no material trending used in underwriting in the last 5 years. As portfolios continue to show signs of traction and improved performance, and providing “condo mania” doesn't come to an abrupt halt, rental properties should only pick up pace from this point forward. This should allow lenders to once again buy into a rosier future.
So, with such a borrower-friendly market, the time to act on multifamily financing is now. This is as good as it gets.
Faron Thompson is managing director of Primary Capital Advisors in Atlanta.
©2005 France Publications, Inc. Duplication
or reproduction of this article not permitted without authorization
from France Publications, Inc. For information on reprints
of this article contact Barbara
Sherer at (630) 554-6054.
|